
Most scientists will encounter statistics at some point in their career. Sometimes people find them confusing and end up making logical errors in how they interpret them. Along with this, there are many examples of spurious correlations created for our amusement on the internet. I mean didn’t you know that mozzarella cheese consumption is positively correlated with the number of doctorates awarded to civil engineers? Well stating that is fine but just because two random variables are correlated doesn’t mean they are related. Other hiccups can occur when people start using p-values. This snack is going to make the point that you should beware of the transposed conditional. I read a very good paper by Maarten H. P. Ambaum (2010) that highlights this issue, among others, and I hope to provide a very brief (and basic) overview of that message here.

A spurious correlation. Reproduced with permission from Spurious correlation from http://tylervigen.com/
Types of Tests
There is a huge array of different statistical tests, each one tailored to a specific type of data/hypothesis that researchers may be working with. The first difficulty often comes in trying to apply the appropriate test. Typically if your data set is normally distributed then you should opt for one of the t-tests. These vary depending on if you have one or two samples and, if your are working with two samples, whether they have the same number of members and variances. If your data does not follow a normal distribution then you need to apply a non-parametric test such as a Kolmogorov-Smirnov test that makes no prior assumption on the distribution of your data. Regardless of what test you apply you will most likely be presented with some form of test statistic and a p-value based upon it. For example if you applied a t-test you would get a t-value that typically reports an indication of the differences between data means.
P-values
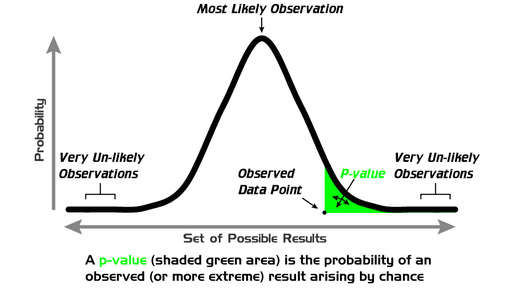
P-value schematic. From https://en.wikipedia.org/wiki/File:P_value.png User:Repapetilto @ Wikipedia
A researcher typically has a hypothesis and to apply the statistical test they need to formulate the null hypothesis. For the purposes of this article let us state the null hypothesis is of the form ‘My hypothesis is not true’ – although in reality it is more complicated than this see Wilks (1995) or von Storch and Zwiers (1999). In the statistical test you assume your null hypothesis is true and the p-value returns the probability that you would have found a test statistic equal to or larger than what is calculated using your data. To explain this schematically look at the Figure above: your test statistic formulated using your data is the ‘observed data point’ and the p-value returns the shaded area to the right of this (for a one-sided test). A low p-value simply tells you that it unlikely you would have observed your data when the null hypothesis is true; i.e. in this case when your hypothesis is not true.
Where it could go wrong
Now we have our p-value, what can you conclude from it? This is ultimately where people can occasionally stray from what the statistical test is telling them. Your p-value informs you about when it is assumed the null hypothesis is true – it doesn’t, on its own, tell you anything about when your actual hypothesis is true.
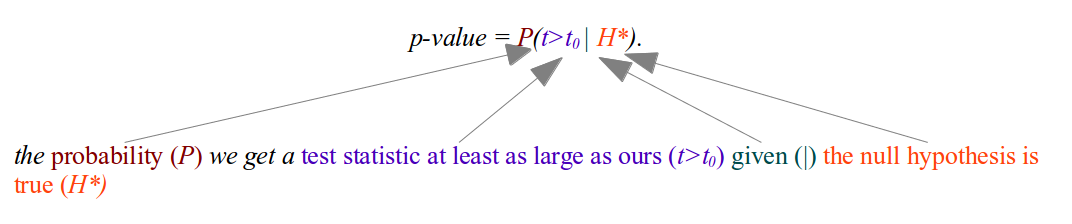
Time for a little bit of maths (just a little I promise!). We will label your hypothesis H, your null hypothesis H*, the test statistic of the data is t0 and an arbitrary test statistic given by t. Mathematically a p-value is given by:
 If you want to know how likely your original hypothesis was given the fact that you are observing a test statistic at least as large as yours then you need:
P(H | t>t0)
So let us say your p-value was 4%, and then you try and say that there is a 96% chance that you are observing your data due to your hypothesis being true; you are trying to claim that
?? P(H|t>t0) = 1 – p-value ??
This is wrong! You are seeing first hand the error of the transposed conditional. The correct way to formulate this relationship is using the complementary which yields
P(H|t>t0) = 1 – P(H* | t>t0).
↑
This is not the p-value
The p-value can be related to the probability of your hypothesis using Bayes Theorem, see Ambaum (2010), but you need the prior odds of your hypothesis first – something that is very difficult to derive in most scientific disciplines. The take home message from this is that you cannot deduce a statement of the validity of your hypothesis using only the p-value.
Conclusions
A p-value gives you a nice sanity check that what you are seeing is not noise and likely to occur given your null hypothesis is true. You can definitely use it to supplement your scientific argument but you will end up on thin ice if you try to claim your hypothesis is true from statistical testing alone!
References
Maarten H. P. Ambaum, 2010: Significance Tests in Climate Science. J. Climate, 23, 5927–5932. doi: http://dx.doi.org/10.1175/2010JCLI3746.1
Von Storch, H., and F. W. Zwiers, 1999: Statistical Analysis in Climate Research. Cambridge University Press, 484.
Wilks, D. S., 1995: Statistical Methods in the Atmospheric Sciences: An Introduction. Academic Press, 467.
Thank-you to the ClimateSnack UEA group for all of the very helpful feedback which has substantially improved this piece.
 0
0
 0
0 0
0 0
0 0
0 0
0Amee O'Callaghan
Latest posts by Amee O'Callaghan (see all)
- Glorious Glories - May 11, 2015
- Statistics in Science - December 2, 2014
- A History of Climate Models - January 22, 2014