
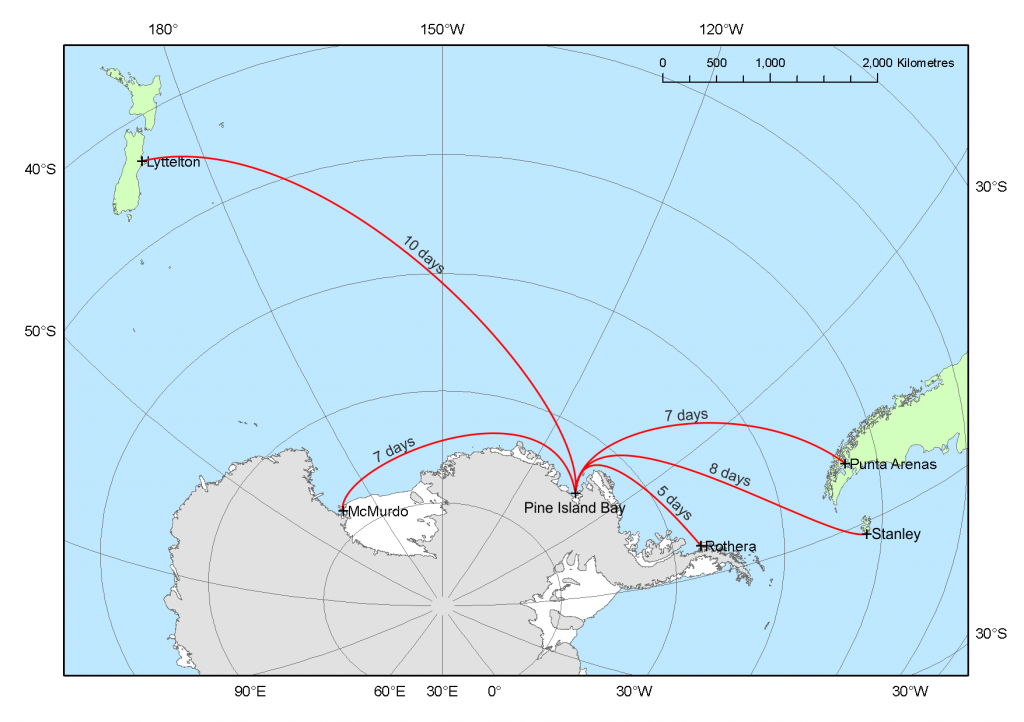
Figure 1: A map showing the location of the Amundsen Sea within Antarctica and the ship transit time to other destinations. (Source: http://www.istar.ac.uk/press-media/maps/)
In early 2014 I participated in a research cruise to the Amundsen Sea, Antarctica. This article will describe why we as scientists are interested in this part of West Antarctica and what we did while we were on-board the ship. Antarctica is an extremely inhospitable environment and the Amundsen Sea is one of the most remote parts of the continent. Some 1300 kilometres to the west of the Antarctic Peninsula, it is in the deep south of the vast Pacific Ocean thousands of kilometres from the continents of South America and Australia (see map in Fig. 1). In the late 1990s it was discovered that glaciers within the Amundsen Sea sector were thinning and retreating more rapidly than any other glaciers in West or East Antarctica (Wingham et al, 1998). Then, in 2006 it was found that Amundsen Sea glaciers were contributing approximately 0.15mm per year or 6% of annual global sea level rise (Shepherd and Wingham, 2007, Bracegirdle, 2012).
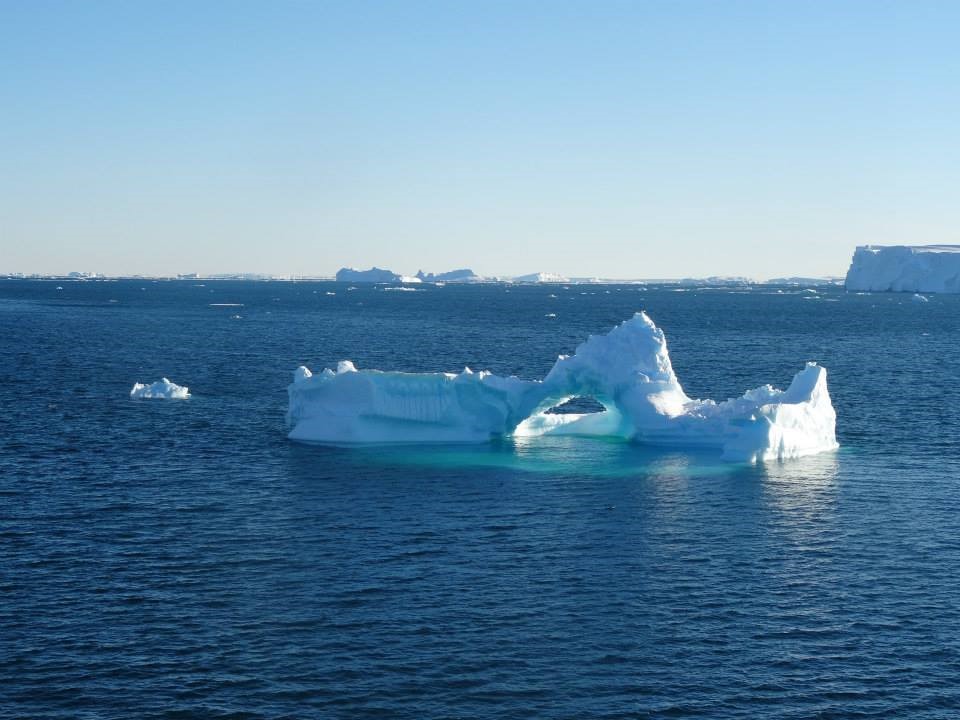
Figure 2: Icebergs were a hazard for many weeks during the cruise, there was always somebody on watch on the bridge to ensure we didn’t crash in to a berg that could damage the ship.
These discoveries have caused a surge of scientific studies in the area. In recent years it has been shown that relatively warm circumpolar deep water intrudes on to the continental shelf and is then transported towards the region’s largest glacier, Pine Island Glacier (PIG), where it can melt the base of the ice shelf (e.g. Jacobs et al 2011). In order to accurately predict the rate of global sea level rise, it is crucial to investigate the causes of the rapid retreat of glaciers in this region and assess the likelihood that this process will continue at the same pace in the future.
The aim of the ice sheet stability research programme (iSTAR) is to observe the ocean and the atmosphere close to PIG from a research ship. Alongside this the glacier itself will be visited during two ice based tractor traverses. In early 2014 the RRS James Clark Ross transported myself and twenty-three other scientists to Pine Island Bay. The ship travelled on to the continental shelf and along a transect towards PIG. This allowed us to observe the transport of warm circumpolar deep water lying hundreds of metres below the surface. During the cruise the conductivity, temperature, depth (CTD) sensor was deployed over 100 times to collect profiles of temperature and salinity from the surface of the ocean to the sea floor. As well as having instruments to observe temperature and salinity the CTD also has a number of bottles to collect water samples from different depths. During the iSTAR cruise these water samples were used to analyse the amount of trace gases and dissolved oxygen in the ocean. By combining these two measurements the science team will be able to calculate the amount of meltwater flowing away from the ice shelves and identify its location within the water column.
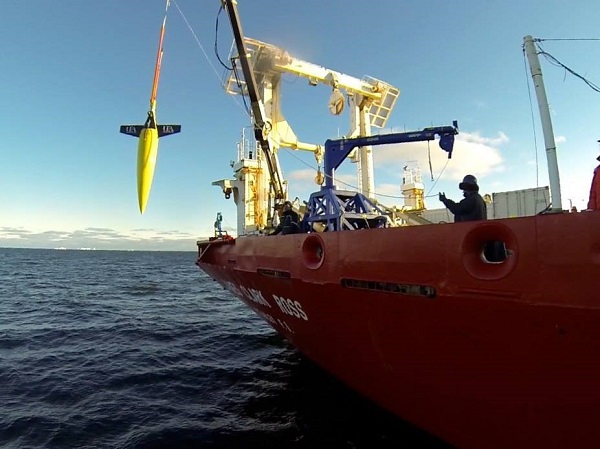
Figure 3: One of the Seaglider deployments during the iSTAR cruise. The surface ocean water temperature is -1°C and the air temperature -10°C!
Alongside the CTD measurements we also had three exciting pieces of new technology to use during the cruise. We deployed two Seagliders (see Fig.3) to obtain high resolution observations of dissolved oxygen, temperature and salinity. The Seagliders are remotely programmed to dive towards the sea floor and rise back to the ocean surface to send data via satellite. The cold ocean water and weather did have an impact on the gliders; one developed a technical fault, and the other had a problem with ice forming on the antenna, restricting communications.
The second piece of equipment was a vertical microstructure probe (VMP) which is designed to measure small scale turbulence in the ocean. This was deployed regularly close to the ice shelf in order to observe the magnitude of turbulence in the meltwater flowing away from PIG. Autosub-3 was the final piece of new technology used during the cruise. The 3.5 tonne unmanned submarine was pre-programmed to follow a track beneath the ice shelf of PIG. It travelled into the cavity where previously ice would have been present, to observe ocean water properties and map the sea floor below the ice shelf. With an ice shelf above it there is no easy escape route for the submarine if things go wrong, but thankfully it and all of the other equipment returned safely to the ship.
My main responsibility during the cruise was to launch a number of weather balloons. A series of 38 balloons, known as radiosondes, reached altitudes of over 20km and recorded profiles of temperature, humidity and windspeed. These radiosondes were the first launched for research purposes in the Amundsen Sea and are crucial given the lack of in-situ meteorological observations. These observation allow me to evaluate how accurately meteorological models are predicting the weather in this remote region. I will also use them to investigate the local meteorological conditions and any possible effects the weather has on the regional ocean circulation.
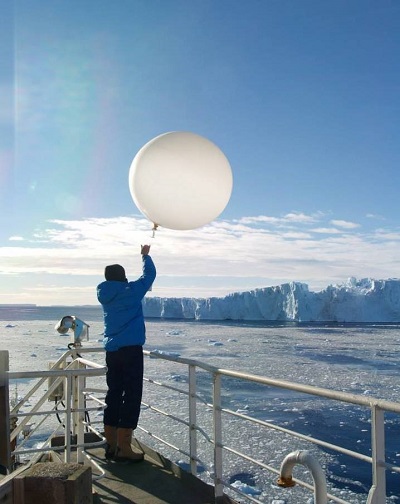
Figure 4: Launching a radiosonde with Pine Island Glacier in the background, what a place to work!
The initial plan was to launch 40 radiosondes, however my inexperience of working in such conditions shone through on two occasions. The more mundane of the two was one morning when I was clearly rather sleep deprived and managed to pop the inflated balloon on a sharp metal object as I was preparing to launch it. On the second occasion there was some really interesting weather in the region; a large, deep cyclone was close by. Being a keen a meteorologist I wanted to launch a series of balloons during the storm as I thought it would be a good case study to write about during my PhD. Of course deep cyclones are also associated with rather strong winds and that makes it slightly tricky to launch a weather balloon. The first three launches of the day were all successful, although the third was rather hairy as the wind speed had increased to 55 kmph. I nearly decided to call it a day at that, but over the next few hours the atmospheric pressure continued to fall and I couldn’t bear to miss the opportunity to profile the atmosphere close to the centre of a large low pressure system! So I assembled a team of five helpers and spotters for the fourth and final launch. Unfortunately, just as the balloon was launched a strong gust of wind took the balloon horizontally for some 40 metres where it crashed, quite spectacularly, into the frame at the back of the ship!
All of these balloons and instruments were deployed during the five week period that RRS James Clark Ross was in the Amundsen Sea. The process of calibrating, analysing and interpreting these complex data sets is a longer one, but the initial results are promising. The aim of this project is to combine these oceanic and atmospheric observations with measurements carried out during ice traverse. This will give an interdisciplinary overview of the processes occurring in the Amundsen Sea sector of Antarctica and whether the glacial retreat observed in recent years is likely to continue. Given the multiple unique data sets that have been collected, along with additional glaciological data from another ice traverse scheduled for the 2014/2015 season it is realistic to achieve this ambitious goal.
For more information about the project please see the iSTAR website http://www.istar.ac.uk/
References
Bracegirdle, T.J., 2013. Climatology and recent increase of westerly winds over the Amundsen Sea derived from six reanalyses. International Journal of Climatology. 33, 843-851.
Jacobs, S.S., Jenkins, A., Giulivi, C. F., & Dutrieux, P., 2011. Stronger ocean circulation and increased melting under Pine Island Glacier ice shelf. Nature Geoscience, 4(8), 519–523.
Shepherd and Wingham, 2007. Recent sea level rise contributions of the Antarctica and Greenland ice sheets. Science. 291(5505), 862-864.
Wingham, D.J., Ridout, A.J., Scharroo, R., Arthern, R.J. and Shum, C.K. 1998. Antarctic elevation change from 1992 to 1996. Science. 282(5388), 456-458.
 0
0
 0
0 0
0 0
0 0
0 0
0Latest posts by Richard Jones (see all)
- The retreating glaciers of the Amundsen Sea - October 2, 2014