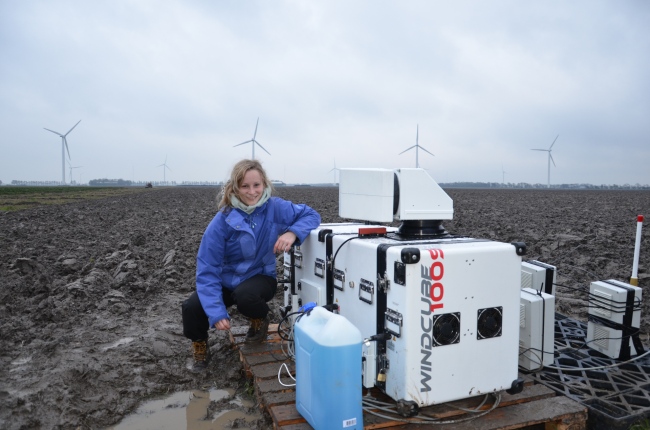
Figure 1: The scanning WindCube 100s at its present location at the wind turbine test farm of ECN in the Netherlands.
Wind energy assessment is a bit of a gamble. Companies use a global wind atlas where the wind climatology is extracted for an area of interest, to pick a hot spot for a new wind park. Masts are then constructed to measure and check the wind conditions for some years. One wind measurement point delivers the information of the flow field at this specific site, and should lead to a basic construction plan, including turbine models, turbine locations and the future rated power. It is now easy to understand why this is a gamble. One measurement point determines the energy production of an area wide wind farm, so that Banks can either call for the project and finance it, or they drop out of the game.
 From a meteorological perspective there are several factors that can crash this kind of bet between the wind energy companies and banks. Wind in the lower atmosphere depends heavily on local conditions. Topography, as well as specific weather conditions, influence the structure and the stratification of the flow inside the atmospheric boundary layer. Flow over mountains and hills can for example induce turbulence on an originally laminar flow. Also the stratification of the atmospheric boundary layer has an impact on flow conditions. During a dry hot day the land heats the air, resulting in a lot of vertical mixing through turbulence bales that gliders use to stay up in the sky. Due to the enhanced vertical motion less energy is available for horizontal wind speeds, which are used for energy production. In contrast, a stable lower atmosphere can enhance horizontal wind speed. A similar acceleration happens to the top carts of a cart stroke if you introduce some wind. As the atmosphere is stable it is also organized in vertical layers, where each cart has a slightly different temperature.

Figure 2: Wind turbine wakes visible through mixing induced condensation in the Horns Rave wind farm.
The gamble is not only risky because of upstream meteorological conditions but also because of interaction of downstream turbines. Behind each turbine a region of enhanced turbulence is generated, which is referred to as wind turbine wake. As the turbines introduce rotation into the system, the wake consists of a conical spiral extending far downstream. Since a wind park consists of several turbines some of their wakes affect other turbines. Approaching wakes have less energy available as well as a higher turbulence level, leading additionally to higher wind loads on the wind turbine blades.
The wind park layout is therefore crucial for optimizing the overall power production. To get the turbine layout, the energy companies use a siting tool, which includes simple wake models for different wind speeds and directions. At the moment, these wake models are too simple to cover the complex wake structure, which is not constant but more a function of time and weather condition.
In order to help improving wake models with empirical studies my research comes into play. I’m working with Doppler LiDAR instruments that can measure wind profiles as well as horizontal and vertical cross sections of the ambient flow field with a resolution between 20 and 100 meters. In present, we are using these instruments to measure single wakes in the scope of the Wind Turbine Wake Experiment – Wieringermeer (WINTWEX-W) at the test wind farm of ECN in the Netherlands. With the collected data we are able to describe wakes in real case studies, in order to find empirical quantities that can improve wake models. More realistic wake models could improve future wind park layouts and the operation of already existing ones. In the end the wind farm would produce more efficiently and the energy companies would have a lower risk of loosing their bet.
In that way, wind energy could become more efficient, leading to a quicker pay off rate and become therefore more competitive in the energy market. Optimizing the energy production would be a sustainable way to make wind energy more attractive compared to the oil and gas industry. An increase in wind energy production, in a sustainable way, is a good way to reach the goal of 2020 in reducing green house gas emission.
I think greenhouse gas emission is a topic that everyone should pay attention to. Moreover, everyone should find his or her own way to contribute to a more environment friendly future. In my situation, being part of a research group for more efficient wind park operations is one part of my contribution to improve and support green energy production. At least I like to think that I’m helping to reduce the odds, so that wind energy is a smaller gamble but a gamble worth taking.


