Satellite data is revolutionising the way we look at our planet. From tracking deforestation and land use changes to identifying built-up areas for monitoring urbanisation, the advantages of this technology are obvious having broad spatial coverage and near real-time availability of key environmental variables. Poorly resourced areas (such as sub-Saharan Africa) can benefit from the use of this technology for disaster and risk management. In particular, precipitation datasets derived from satellites are an important component in monitoring food security and evolving famines. The underlying datasets can, however, vary greatly making it very difficult to identify key areas at risk of food insecurity.
Climate stations are usually required to obtain reliable measurements of local rainfall and to enable projections to be derived for both short and long-term future rainfall patterns (i.e. for weather forecasts and climate modelling). However, extensive areas on the African continent have no functional climate stations and such data is consequently very scarce! The reason for this is not necessarily a lack of infrastructure. For example, Angola had a good coverage of climate stations in the first half of the 20th century but the civil war (1975 – 2002) resulted in a dramatic reduction in the number of operational climate stations, from almost 200 before the war down to less than 10 stations today (Fig. 1). As a result, no precipitation records exist for large areas of the country and hence no reliable estimates can be made.
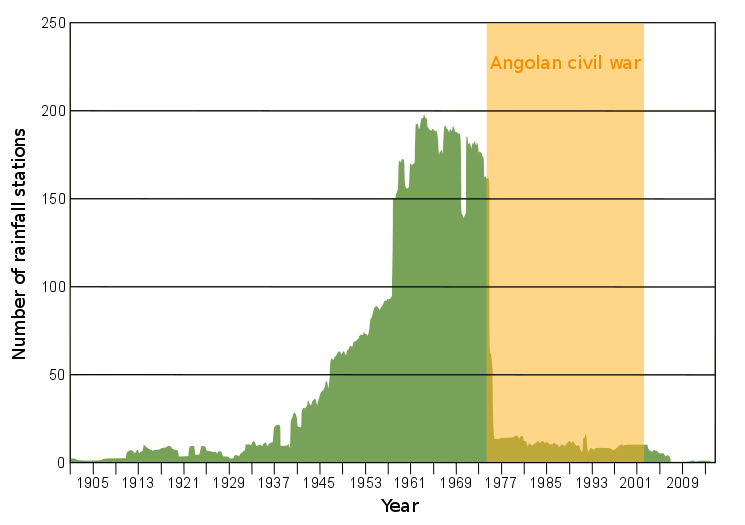
Figure 1: Number of climate stations in Angola from 1901 to 2013 (adapted from Kaspar et al., 2015: 173)
You might wonder why this is important, since we all know how unreliable weather forecasts can be! Well, it is important because the majority of the African population is directly dependent on local rainfall patterns for subsistence agriculture and livestock herding. Family farming is responsible for as much as 70% of the total agricultural production in sub-Saharan Africa, despite the fact that yields are very low at only 0.25 t/ha for staple foods such as pearl millet and maize (Fig. 2). This food system is highly sensitive to even small variations in either the spatial or temporal distribution of rainfall. Farmers need reliable forecasts for scheduling land preparation and seeding, in order to avoid losing the entire yield due to unpredicted dry spells. However, rainfall patterns are expected to change dramatically in the future due to climate change, with more erratic rainfall events predicted, accompanied by more intense droughts.
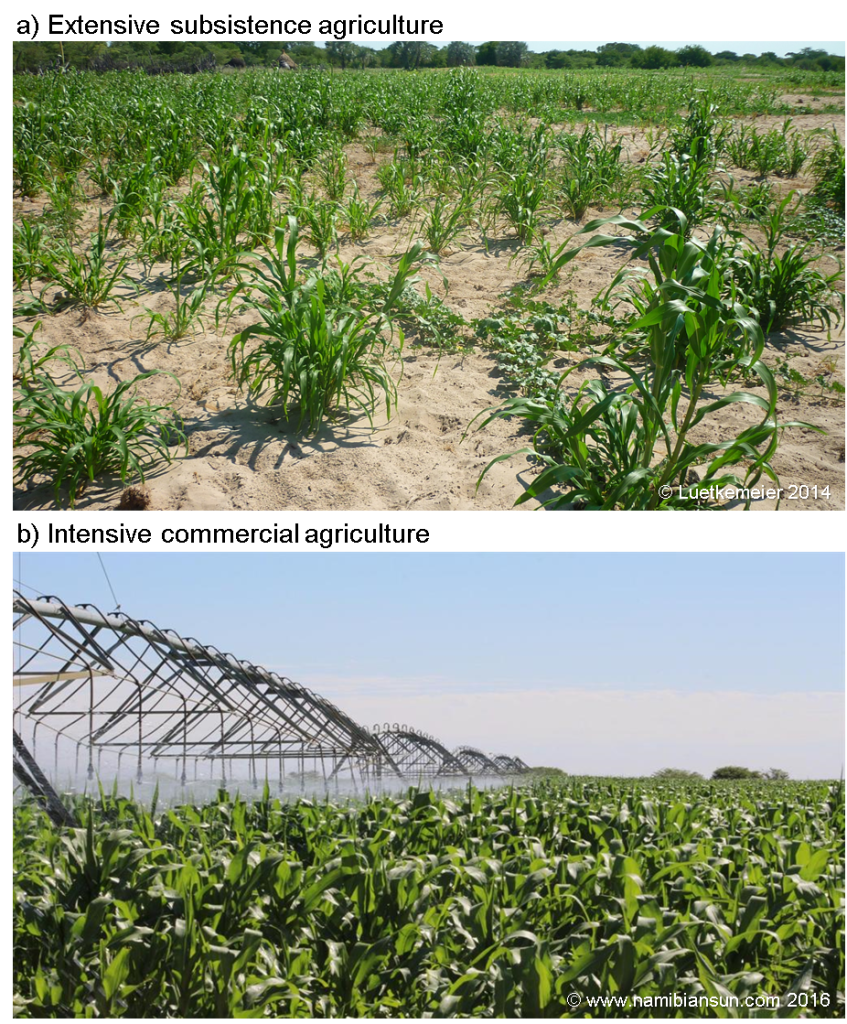
Figure 2: Pearl millet cultivation in (a) extensive rainfed subsistence agriculture, and (b) intensive irrigated agriculture, mainly for commercial purposes.
Effect of uncertainties
Rainfall estimates derived from satellite data have been available since 1976 and present promising opportunities to overcome deficiencies in ground-based data. Satellite-borne systems basically estimate the presence of water in the atmosphere through both active and passive sensing of different wavelengths, ranging from visible light to infrared and microwave radiation. Many datasets are freely available online and have suitable time series and resolutions for a number of different applications. Most datasets even include additional data from ground-based radar stations and traditional climate stations for validation purposes (Fig. 3). As a result, time-series can even reach back as far as 1901!
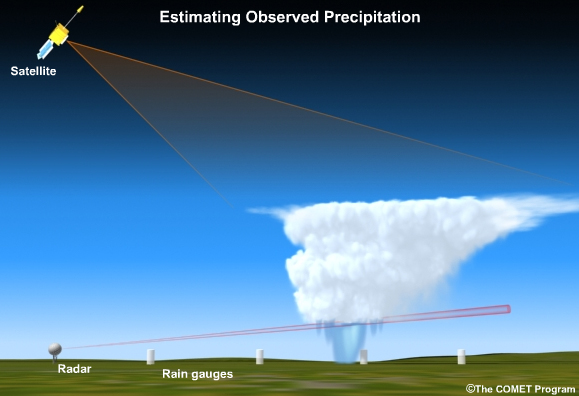
Figure 3: Methods used to measure precipitation (MetED).
Nevertheless, if we look into the various rainfall datasets in more detail there are clearly large differences in the predicted rainfall. At the Institute for Social-Ecological Research (ISOE) in Frankfurt, Germany we are examining the food security conditions in the Cuvelai Basin of southern Angola and northern Namibia. Our research has shown that due to differences in spatial and temporal resolutions, as well as in data collection and processing methods, marked variations exist between the available products. The boxplot diagram in Figure 4 illustrates this by comparing the annual rainfall distributions for the Cuvelai Basin obtained from popular rainfall products that build on satellite derived precipitation estimates in combination with ground-based radar and rain gauge stations. The various datasets can be clearly seen to differ markedly in their precipitation estimates, varying by up to about 200 mm per year when comparing the distributions’ median values!
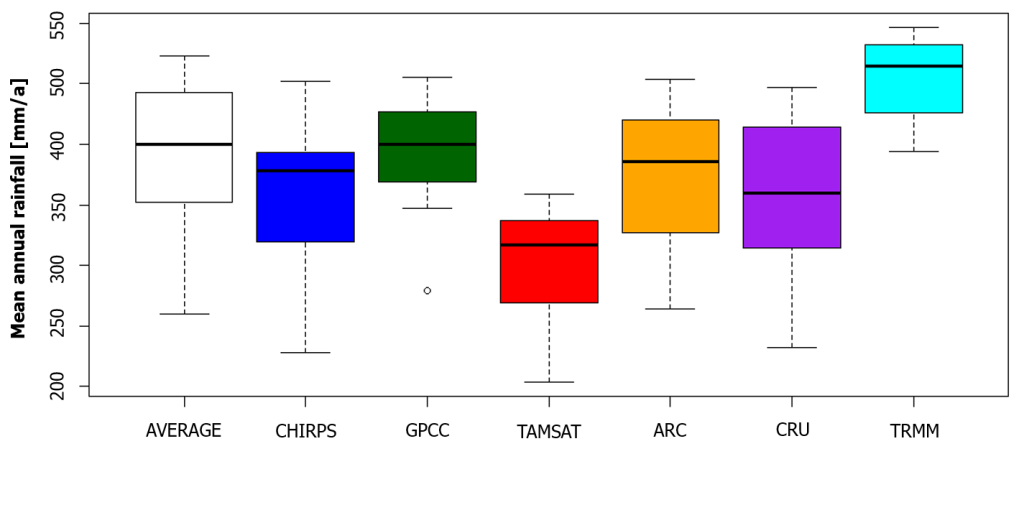
Figure 4: Differences between various precipitation datasets for the Cuvelai Basin of Angola and Namibia.
Dangers of over-reliance on a single dataset
Rainfall data is used as an input parameter for many applications, ranging from coupled plant growth and hydrological models to the monitoring of food security situations and emerging famines. Satellite-derived datasets offer considerable potential for improving disaster and risk management programmes, especially in countries such those of sub-Saharan Africa that lack any adequate climate station coverage. The uncertainty associated with these datasets, however, propagates right through the modelling stage and into the final results. This can lead to strongly divergent results, as seen in the food security monitoring for the Cuvelai Basin. We used a simple rainfall-driven regression model to estimate the pearl millet yields of smallholdings in Namibia, based on the datasets presented in Figure 4 and key macro-nutrient indicators. The results show that the state of food security cannot be determined with certainty since the resulting coverage ratios on the household level show an error of up to 40 percentage points (see year 2009 in Fig. 5b).

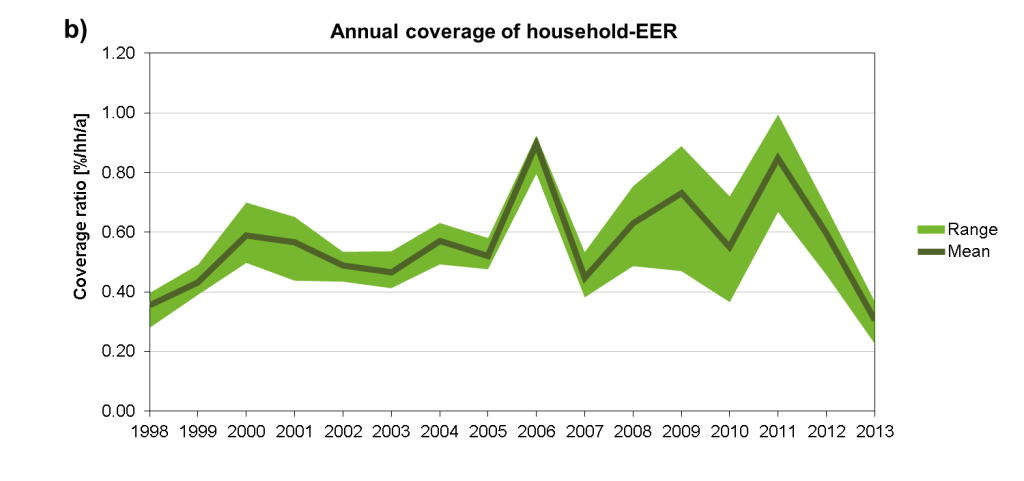
Figure 5: a: Coverage ratios in key macro-nutrient indicators, b: Uncertainty in the coverage of a household’s estimated energy requirements (EER) over time.
What is the key message we want you to remember from this study? Well, it basically comes down to include multiple precipitation datasets as part of an ensemble modelling approach to account for model-specific uncertainty. Ignoring the uncertainty attached to the datasets can result in serious misinterpretations and thus reduce the effectiveness of important applications such as food security monitoring and early warning programmes. Taking the average or median output resulting from multiple input datasets can significantly reduce the uncertainty in subsequent processing steps. It also tells us that we desperately need good weather stations throughout Africa for ground truthing satellite and radar datasets, if we want to be able to provide more detailed and accurate weather forecasts.
This post is part the series published by students of the East Africa Summer school on “collecting, processing and presenting information in bio-geo-sciences”, introduced by Prof. Martin Trauth in a previous snack.
 0
0
 0
0 0
0 0
0 0
0 0
0